
An easy-to-follow, comprehensive guide on using Power BI to analyze the data you need.

1.Locate the ticker symbol for the stock, commodity, index, bond, currency, or cryptocurrency you want to view. You can do this by going to the yahoo finance landing page, finance.yahoo.com
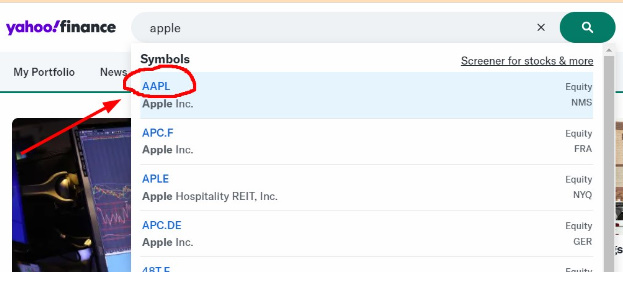
2.Enter the name of the asset you wish to trade; in this example, we’ve chosen Apple. As you can see, after typing the stock name, the ticker symbol appears below the search bar.
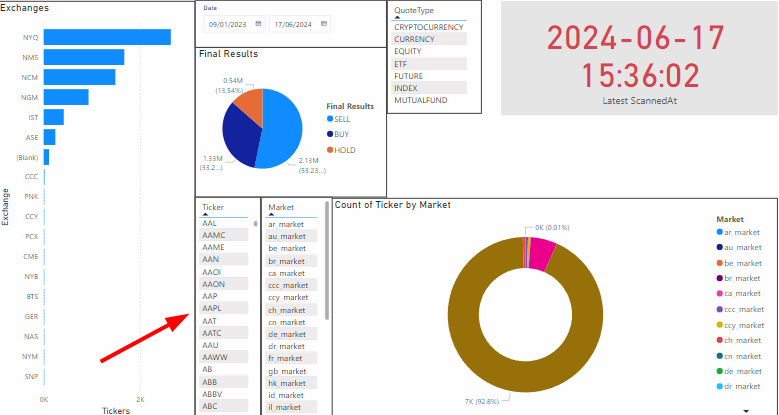
3.Now that you have the ticker symbol, simply search for that symbol in Power BI.
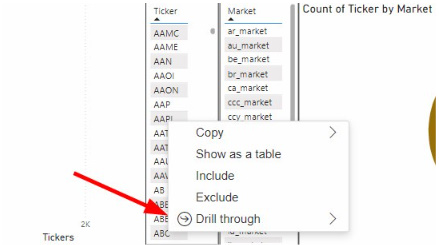
4.Right-click on the symbol, scroll down to the “Drill through” option, and then click on “Ticker details.”
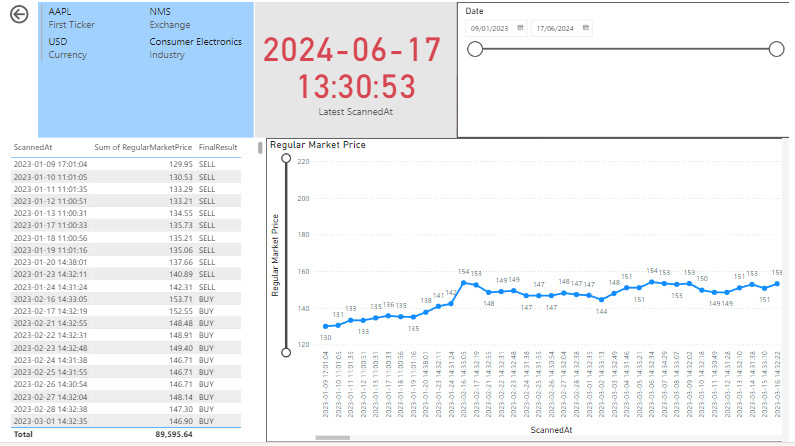
5.You will see a page with a line graph, corresponding with a full list of buy/sell/hold signals on the side of the graph. If you wish to view different dates for the signals that were issued, you may scroll up/down the list of signals on the left-hand corner. This also applies to the corresponding line graph, there is a bottom scroll.
There is a wealth of information when it comes to PowerBi embedded on our website, allowing you to see firsthand how TSA could have helped you, and how it can save you hours of chart analysis and sifting through pages of fundamental information. TSA allows you to simplify your trading activities.